ConvertKit spent over $1.8 million on AWS in 2023

Overview
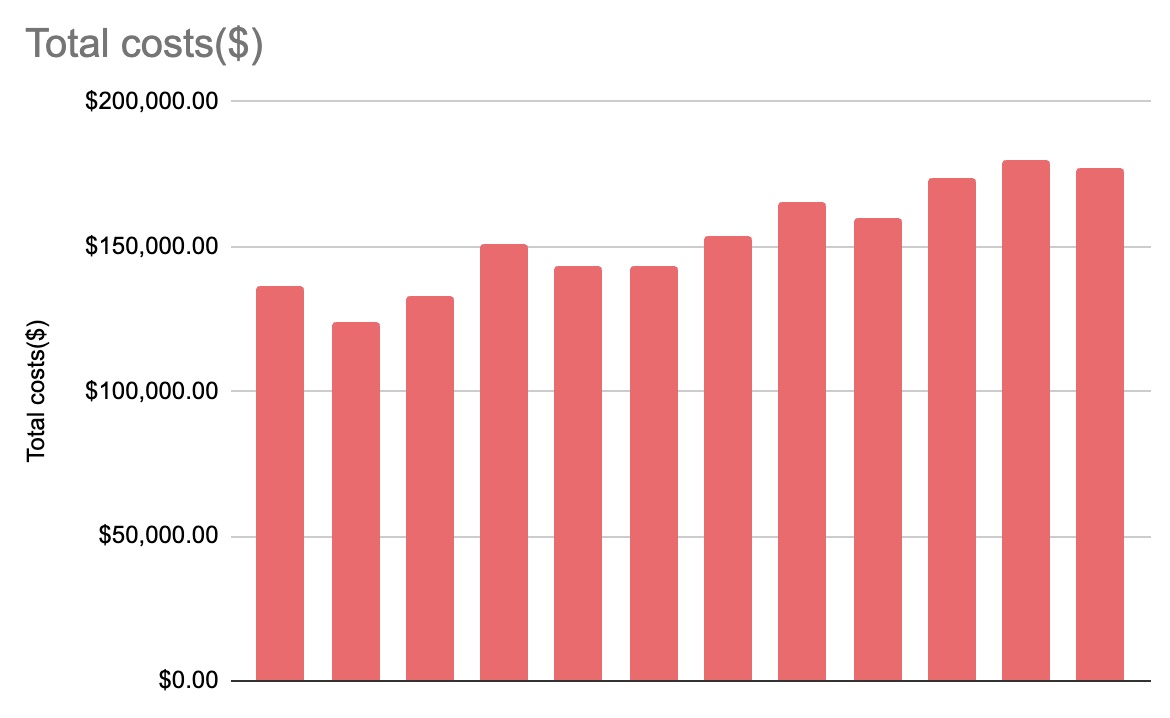
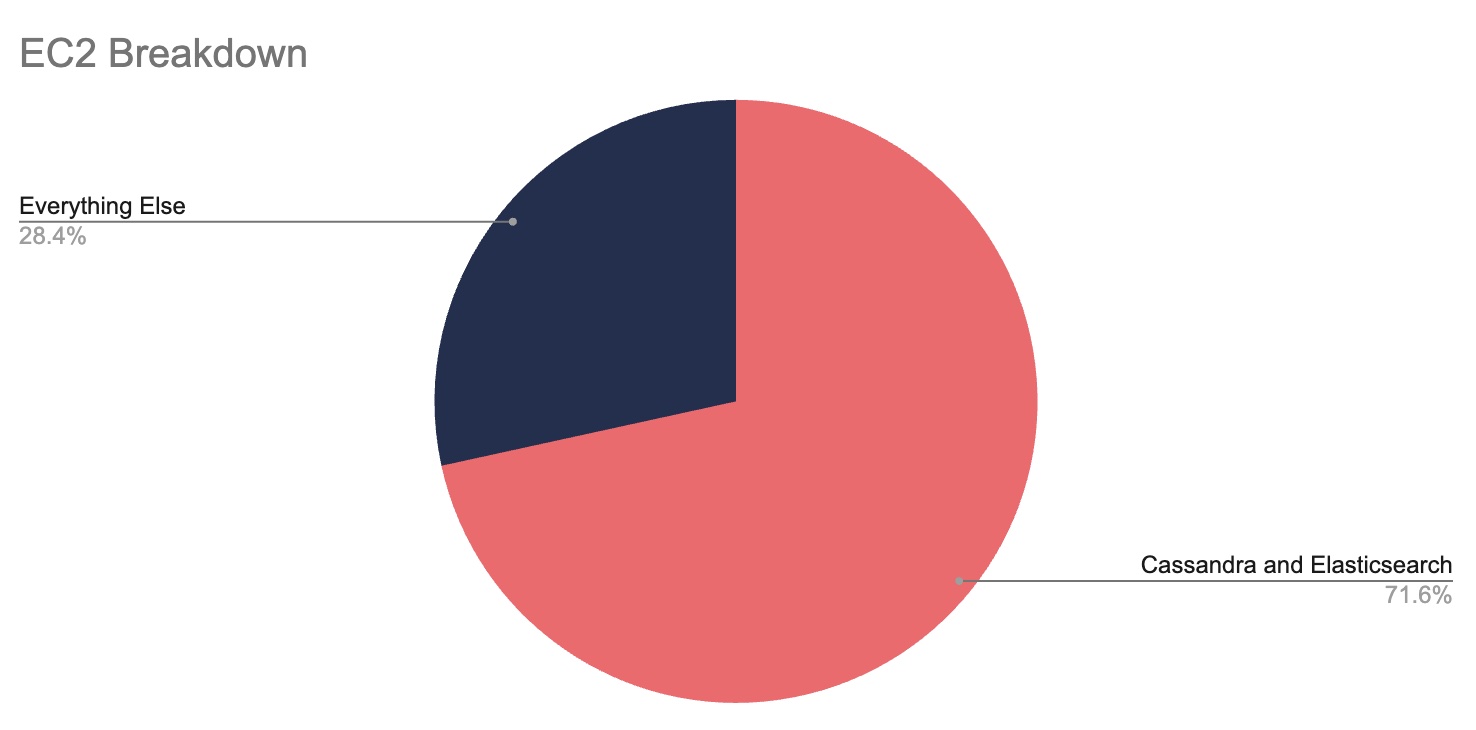
We spent $1,840,785.41 on AWS in 2023. This is up +25% from 2022 and was 4.8% of net revenue for the year. EC2-Instances and Relational Database Service remain our two most used services, accounting for 54% of our annual AWS spending. If we include EC2-Other, Savings Plan For Compute Usage, and Support, which are almost unavoidable accompanying expenses to EC2-Instances, these five services account for 82.7% ($1,523,148.81) of our annual spending. Most of our EC2 spend goes toward our Elasticsearch and Cassandra clusters. We use RDS for our primary MySQL database and smaller databases that power our small services.
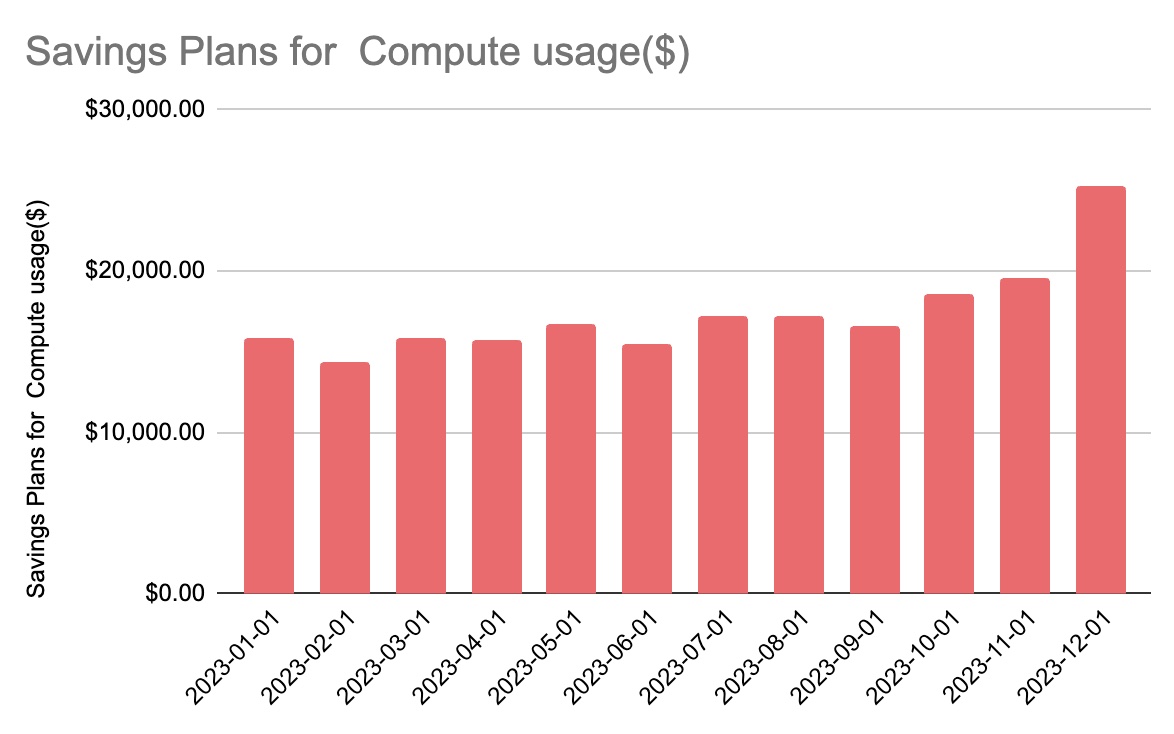
We’ll notice our EC2 growth rate was steep. We sent 2.8 billion emails in December and are continuously growing. Our EC2 costs’ growth rate correlates to our email send volume. Beginning in December 2023, we started getting more aggressive with our savings plans and for the first time, we bought a three-year commitment. It may not seem like a big deal, but it is exciting. I wrote my first public AWS bill breakdown almost five years ago, and back then, committing to such a long EC2 commitment felt intimidating because we were so focused on cost optimization that the idea of being forced to pay for EC2 instances that we might not need, scared me. Today, we know that the bill is not 100% optimal, but we also know that we’ve picked as much of the low-hanging fruit as we’re able to reach, and the best thing we can do now is look to the future. It’s a cool moment, something we’re proud of, and it excites me to think about everything we’ll build over the next three years.
Below is the high-level breakdown of our spending. I’ll go over each service and detail how we use it.
High-level breakdown:
- EC2-Instances - $647,314.93 +34.6% YoY
- Relational Database Service - $342,973.88 +4.4% YoY
- EC2-Other - $213,591.90 +9.5% YoY
- Savings Plan For Compute Usage - $208,361.90 +79.6% YoY
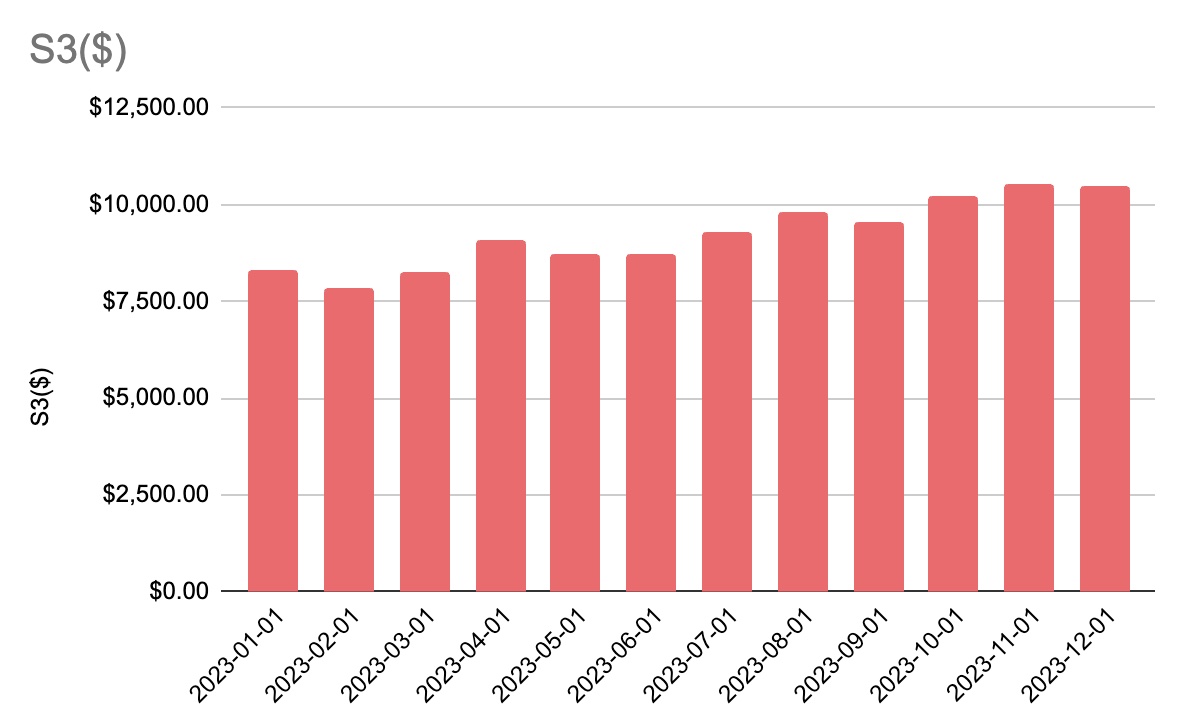
- S3 - $116,551.08 +31.4% YoY
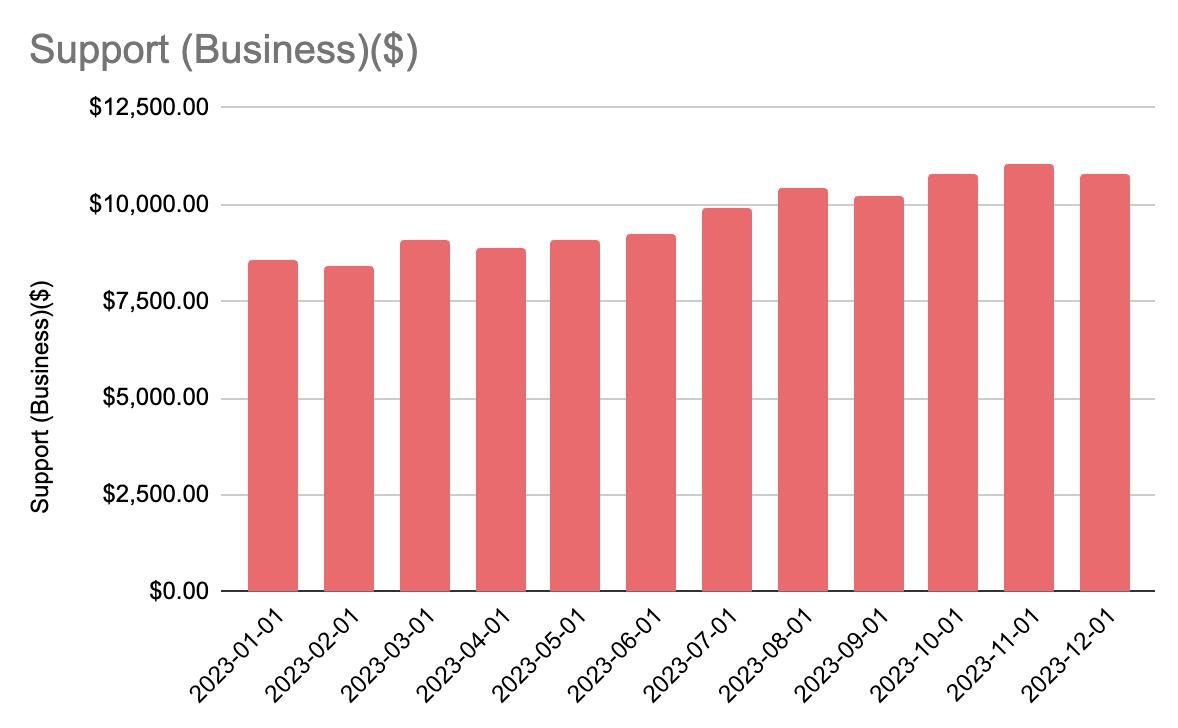
- Support - $110,908.94 +21.9% YoY
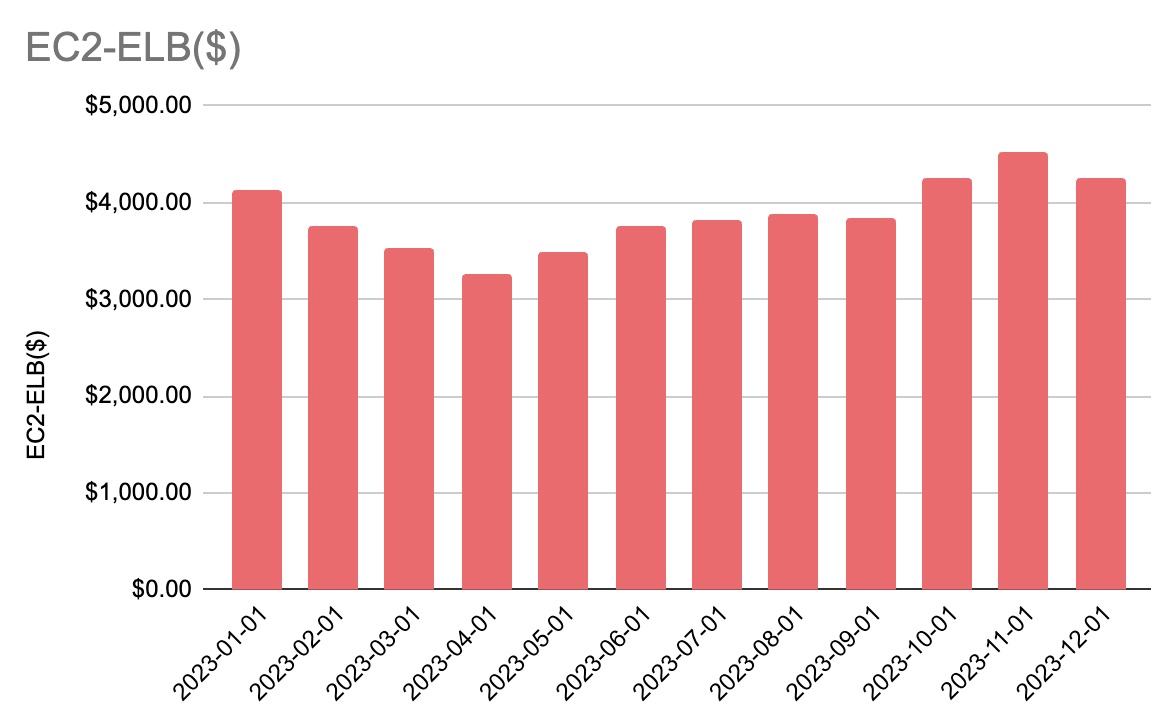
- EC2-ELB - $46,500.34 +7.5% YoY
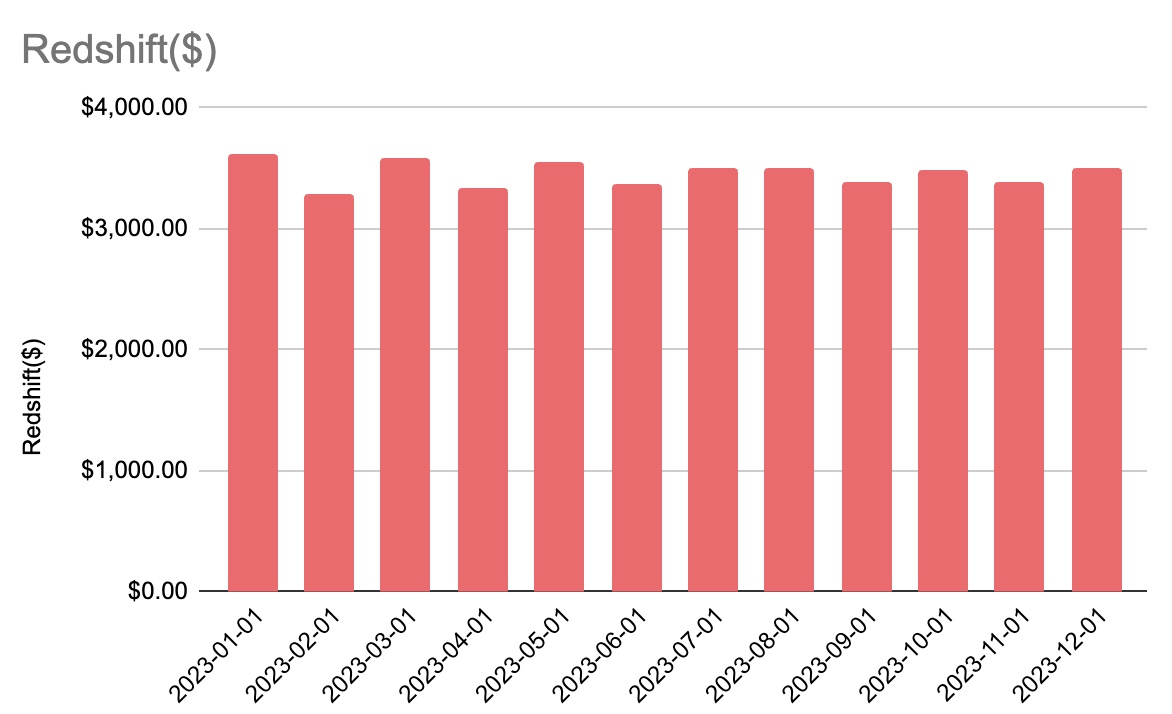
- Redshift - $41,526.68 -3.8% YoY
- Everything Else - $89,401.22 +5.6% YoY
Total Monthly Spend
EC2-Instances - $647,314.93 +34.6% YoY
Our EC2 spending increased by +40.2% from January to December. EC2 is the most significant and fastest-growing expense on our AWS bill. ConvertKit uses EC2 for all customer-facing workloads and the storage layer for all email data. Email and subscriber data are incredibly high-volume and incredibly write-heavy. We heavily use IO-optimized and SSD-backed instances to account for both requirements.
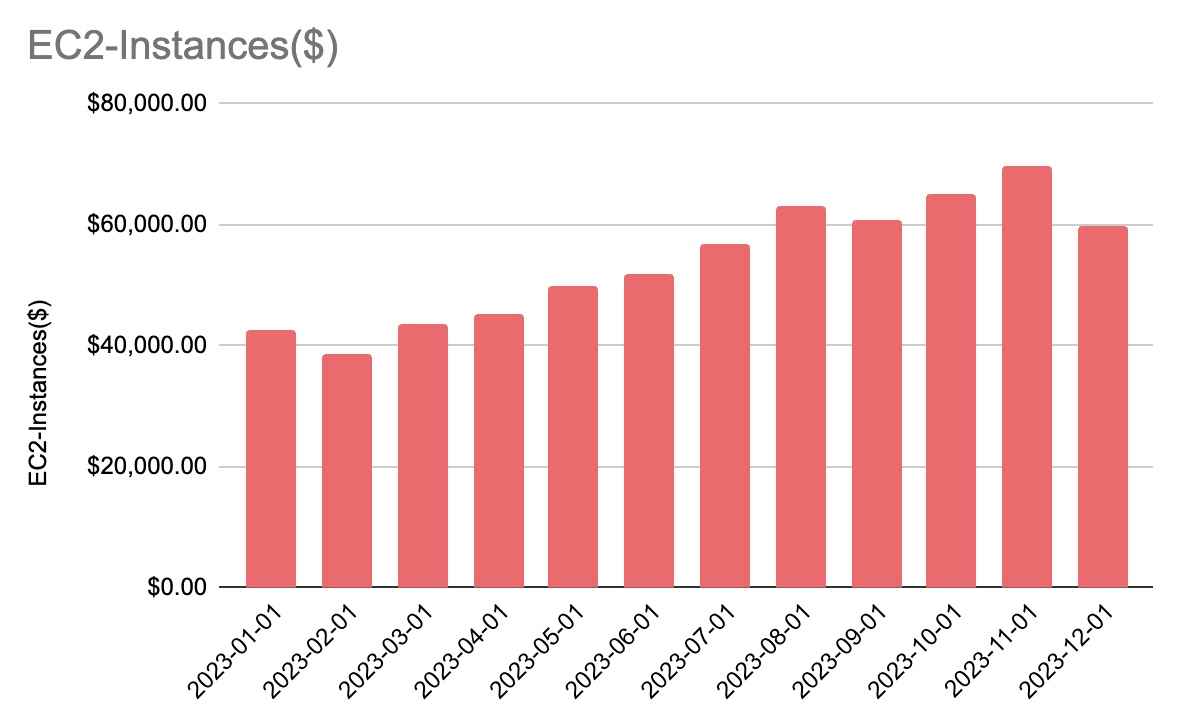
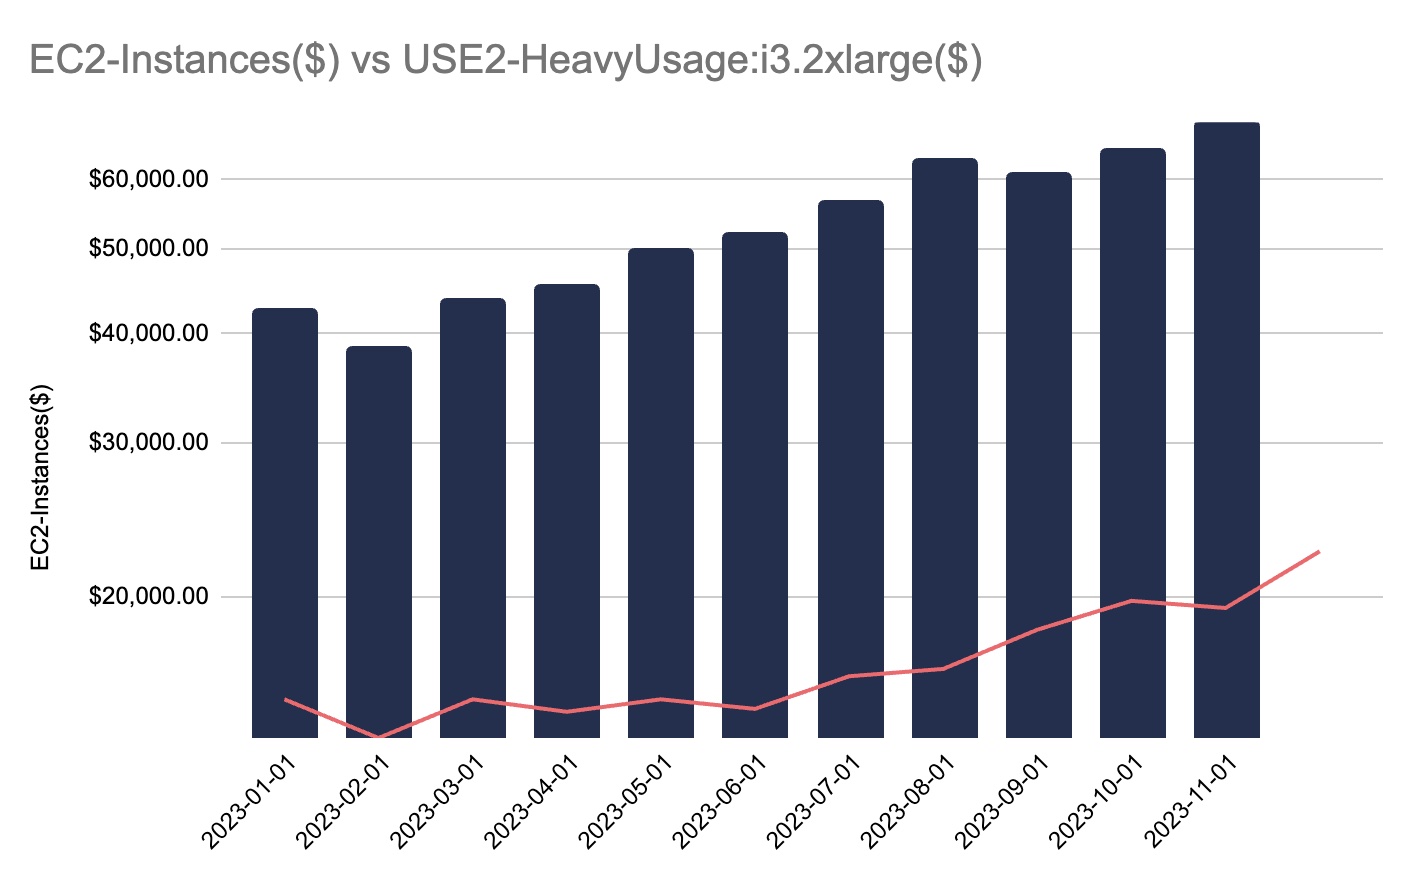
Looking at the usage type charts, we can immediately see the outlier. USE2-HeavyUsage:i3.2xlarge($) is the line item for reserved i3.2xlarge instances. We use these exclusively in our Cassandra cluster, and we use them heavily in our Elasticsearch clusters. If I had to pick a number out of our AWS bill to represent the growth trajectory of ConvertKit, it would probably be the USE2-HeavyUsage:i3.2xlarge($) line item. It means emails are sent, subscribers are gained, links are clicked, and creators use a tremendous amount of other data to build and optimize their businesses.
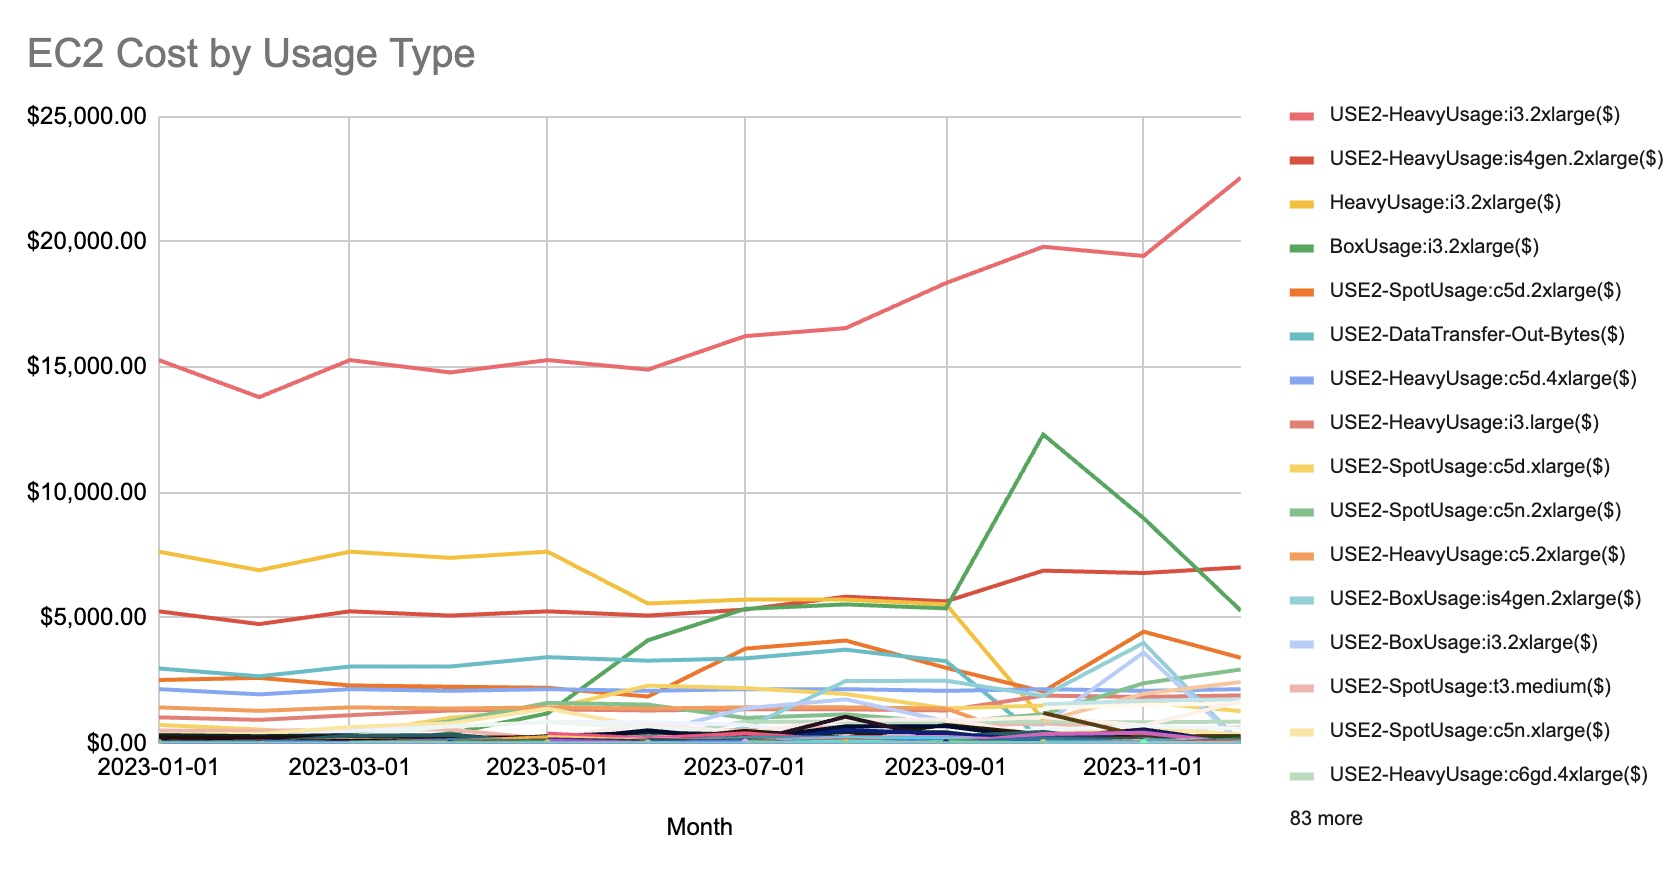
As exciting as it is to view this growth from the lens of creator success, this growth rate is very expensive. Our usage of the i3.2xlarge instance type grew +47.6% from January to December. This instance type alone accounted for 12.8% of our total AWS cost in December 2023. Checking the growth rate of this instance type over total EC2 spend, we can see how fast it’s growing.
Aside from only the i3.2xlarge instances, we also use other SSD and IO-optimized instance types. The is4gen.2xlarge is much like the i3.2xlarge but trades some memory for increased storage. Looking through the legend on the EC2 Cost by Usage Type graph, you will also see the c5d and c6gd instance types. These are CPU-optimized instances with SSD backing. These are very fast and incredibly powerful machines. We use them for our hot nodes in our Elasticsearch clusters. They can index and read more data concurrently than any other instance type we’ve found. The downside is that they don’t have very much storage, and they are incredibly expensive. It’s also a great instance to show the value of savings plans and reservations.
The on-demand cost is $0.6144/hour or $448.51/month. However, a three-year, all-upfront Compute Savings Plan costs $6,961.57 upfront, which is $193.38/month. Depending on your needs and timeline, the cost of using this instance can be reduced by almost 57%. Even taking advantage of savings plans (more below), the cost breakdown of our EC2 usage by workload is pretty fascinating to look at.
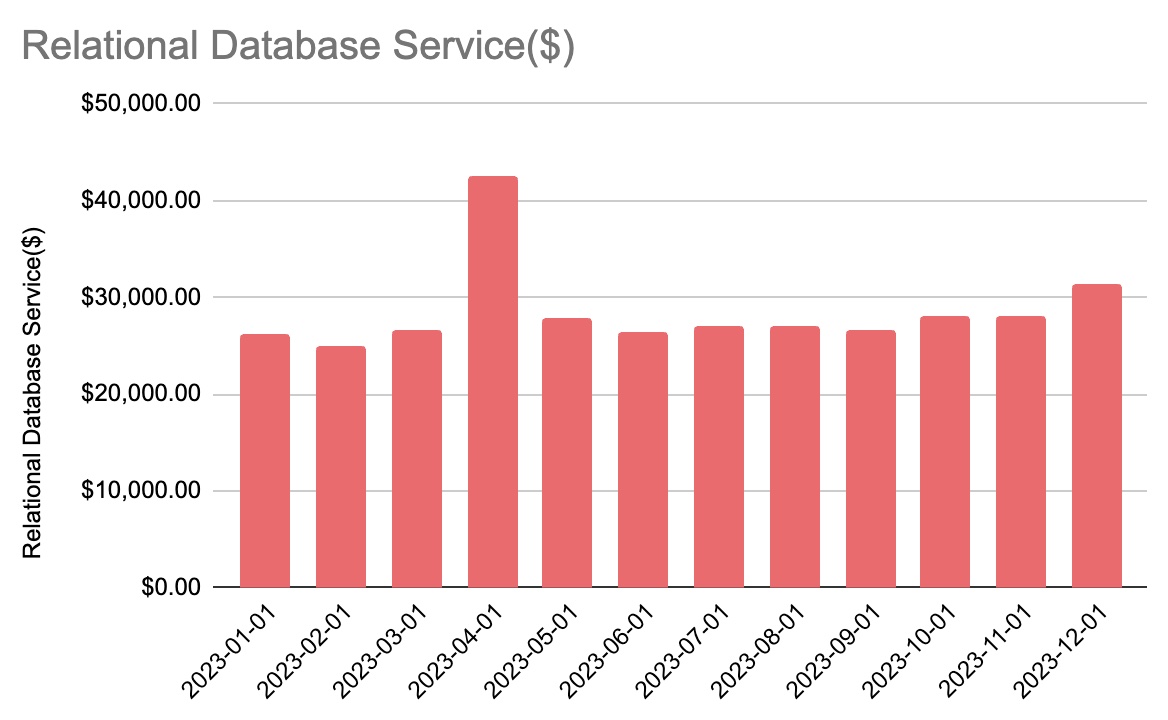
Relational Database Service - $342,973.88 +4.4% YoY
After years of effort, we’ve gotten ourselves to a stable and predictable RDS spend. RDS is an excellent service for small teams like ConvertKit because it reduces operational complexity in most cases. However, you can see that we have a few months where the cost of RDS increased substantially. That happens every time we have to do database maintenance.
…
Looking at this graph, we average a little more than $24,000/month if we don’t include the months we did maintenance. If we include our maintenance months, the average is about $27,000/month.
In 2023, we had one maintenance window in April and were planning another in December. Our monthly average cost for RDS during non-maintenance months was $26,901.23. RDS is now a very stable bill. We only see permanent increases when we have to scale out storage.
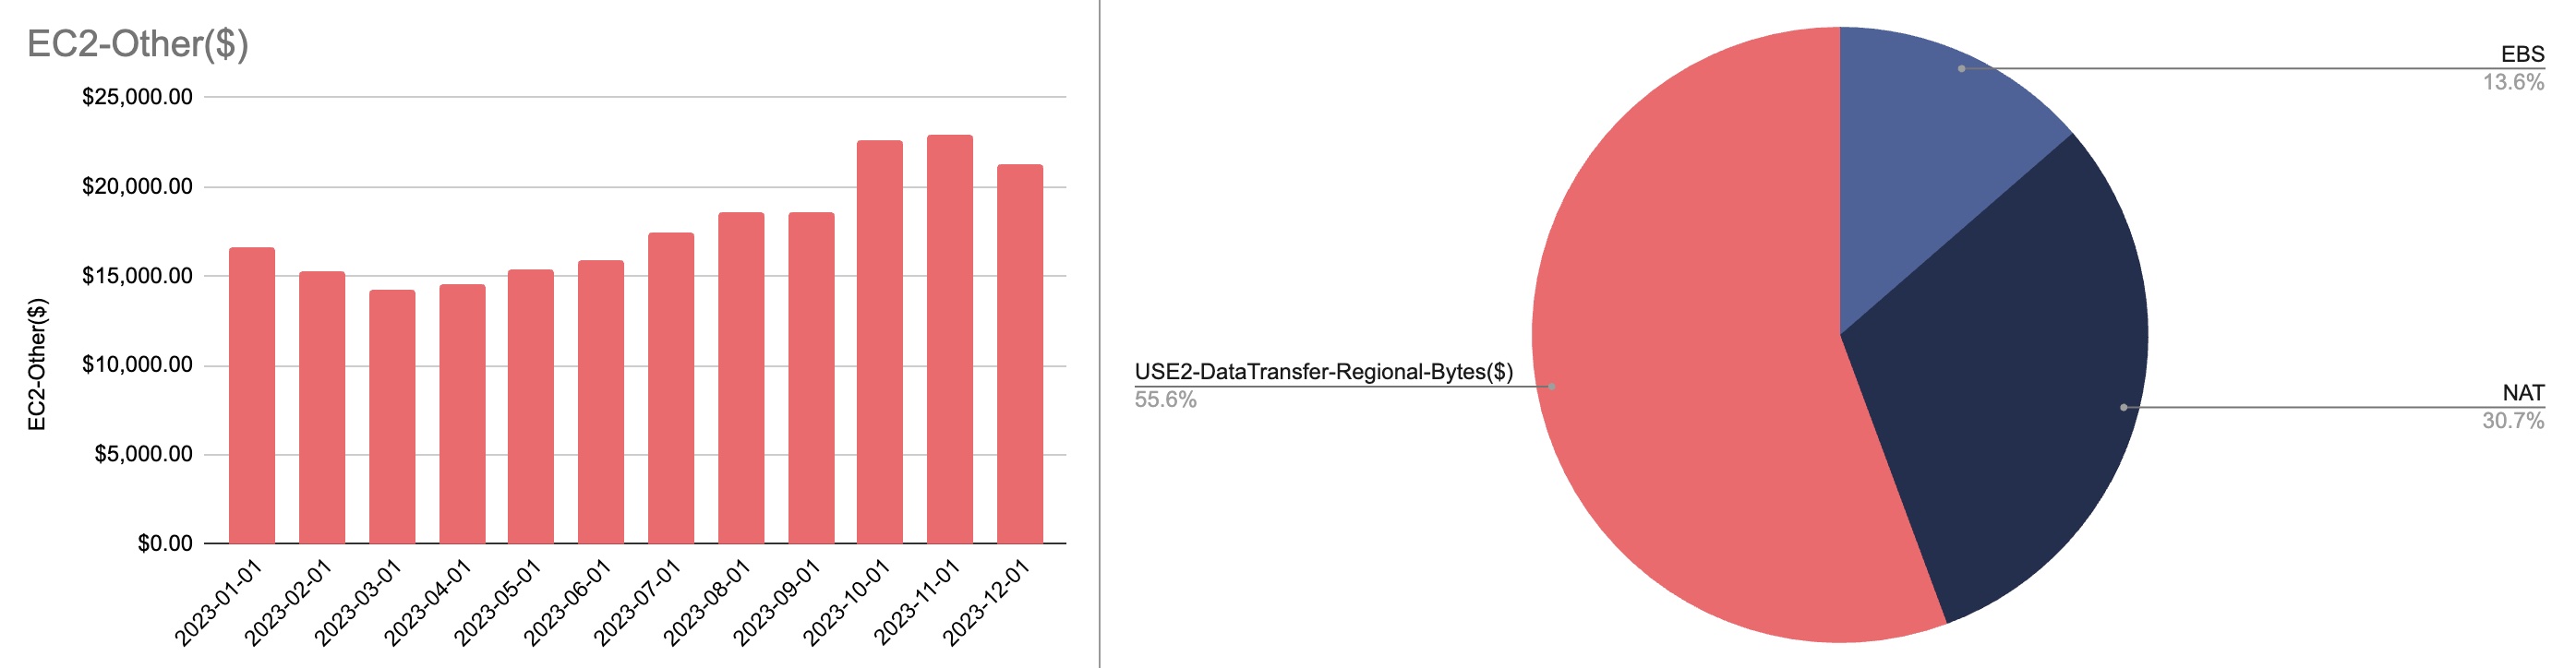
EC2-Other - $213,591.90 +9.5% YoY
EC2-Other grew about +27.7% from January to December. We spend most of our EC2-Other bill on regional data transfer. The biggest line item here is USE2-DataTransfer-Regional-Bytes($), which totaled $107,332.95 for the year. Another way to view this number is “it cost ConvertKit $107,000 to move data around Ohio in 2023.” Over 50% of our EC2-Other bill is simply moving data around Ohio, our primary data center.
AWS-managed NAT gateway is our second most expensive EC2-Other cost growing +46.1% from January to December. Looking at the growth, we went from 94,015.06 GB of NAT egress in January to 125,539.42 GB of NAT egress in December. In total, we pushed 1,317,431.78 GB (1.3PB) through our NAT gateway in 2023, which cost us $59,284.43.
Savings Plan For Compute Usage - $208,361.90 +79.6% YoY
I mentioned in the intro that for the first time, ConvertKit committed to a 3-year savings plan. We’re scaling out our savings plan usage much more aggressively than ever. We’ve optimized our web workloads to be spot instance heavy, only relying on on-demand instances if no spot instances are available. We have instance reservations for most of our data stores. The only real place we have left to squeeze EC2 cost efficiency is from savings plans. As our instance usage increases to keep up with our continual growth, the best thing we’ve done is combine spot instances with savings plans. Combining these two tools allows us to keep costs on most instance types low. Keeping our average EC2 cost low enables us to highlight the parts of the bill that need attention. Because of savings plans and spot instances, it’s easy for us to look at the bill and see the outsized impact the i3.2xlarge instance has on our EC2 costs. Since we know exactly what we use those instances for, we can file that away as its own project to tackle when time allows. Until then, we know that no other instance type or use case is very expensive because it’s covered by a reservation, a spot instance, or a savings plan.
S3 - $116,551.08 +31.4% YoY
41.4% of our S3 spend is on storage, 26.4% is on data transfer to the Internet, and the remaining 32.2% is mostly on requests that cause the data transfer to the Internet.
Our S3 bill is also a byproduct of our growth. S3 is where we store the backups to our Elasticsearch and Cassandra backups. As the data in Elasticsearch and Cassandra grows, so does our S3 bill.
Support - $110,908.94 +21.9% YoY
The cost of support changes with usage. Because our AWS cost increased month-over-month, we spent more on support as we spent more on everything else.
EC2-ELB - $46,500.34 +7.5% YoY
Our ELB costs increased by +3% from January to December. In March of 2023 we reduced our USE2-LCUUsage($) costs by -45% which is awesome because despite our USE2-DataTransfer-Out-Bytes($) costs increasing by +42% from January to December, the reduction in LCU Usage made it so this bill was primarily flat all year.
Redshift - $41,526.68 -3.8% YoY
Last year, we invested heavily in our Redshift cluster to improve the stability and performance of our data pipeline. We finished the last of the migration process in January 2023, making our Redshift bill stable for the rest of the year.
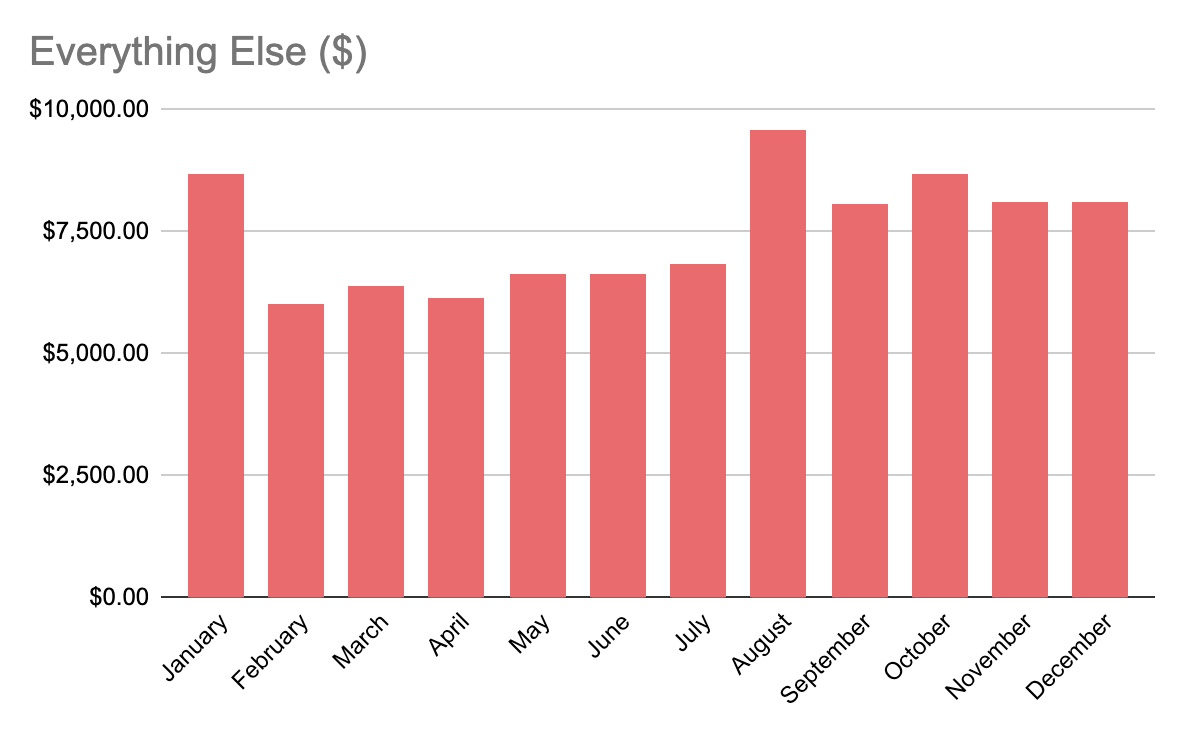
Everything Else - $89,401.22 +5.6% YoY
A lot has stayed the same here from last year, but there are two noticeable outlier months. We tried the AWS managed Prometheus service in January but turned it off because it was too expensive. Then, we had two spikes in our Route 53 bill. Those came from August and October. During those two months, we had significant increases in the number of DNS queries we received. In August, we received 5,450,143,037 Queries, a 210% increase month-over-month. In October, it was even worse; we received 8,427,318,297 Queries, which was 220% higher than in September.
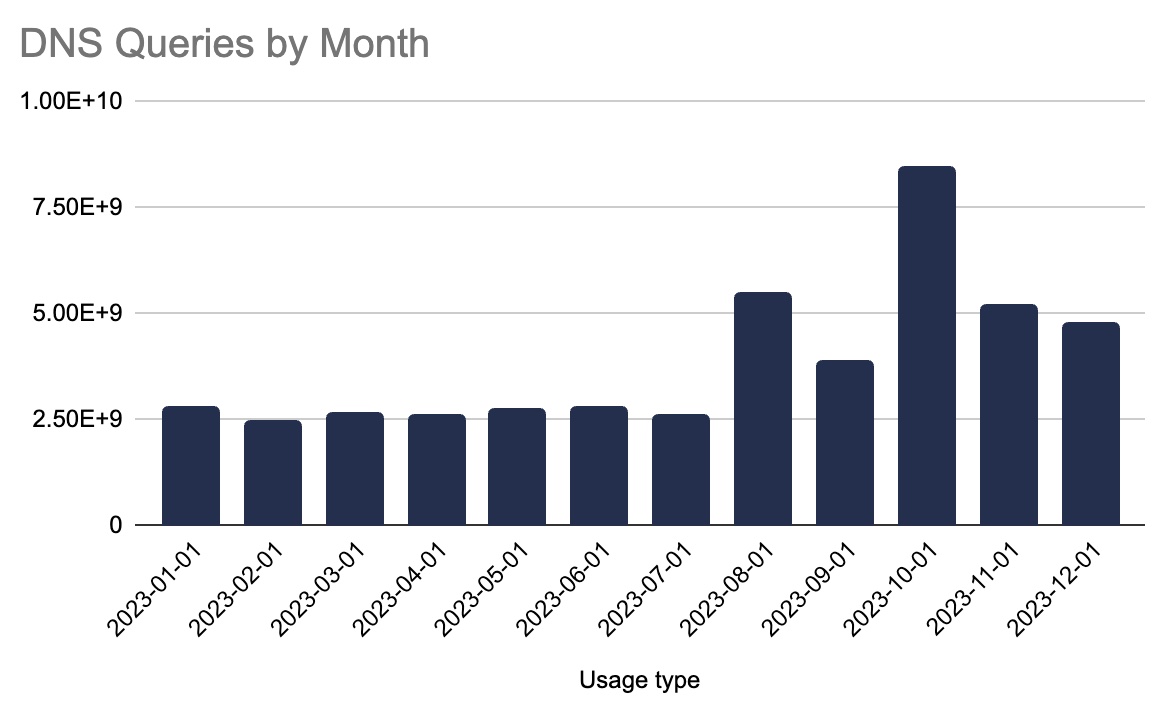
The August DNS queries were a +79% MoM increase, and the October DNS queries were a +95% MoM increase in cost, respectively. Interestingly, our DNS queries were stable until they increased in August. Once that happened, they never returned to their original level. It’s something we have to investigate more.
Conclusion
Our bill is boring at this point, which is a nice place to be. We know exactly what our most significant costs are and why. We have a few challenges ahead of us, but the scope of those challenges is isolated to only a few parts of the bill. We’ve reached a point where we can ask, “our usage of these services will only continue increasing. How do we make it cost-effective?” That’s a really cool place to be.